Gallery
Public networks rendered with LaNet-vi 5.3.1: the Internet, social, scientific and communication graphs, decomposed into k-cores, k-denses and d-cores. Every figure and number below was produced by one script and can be regenerated.
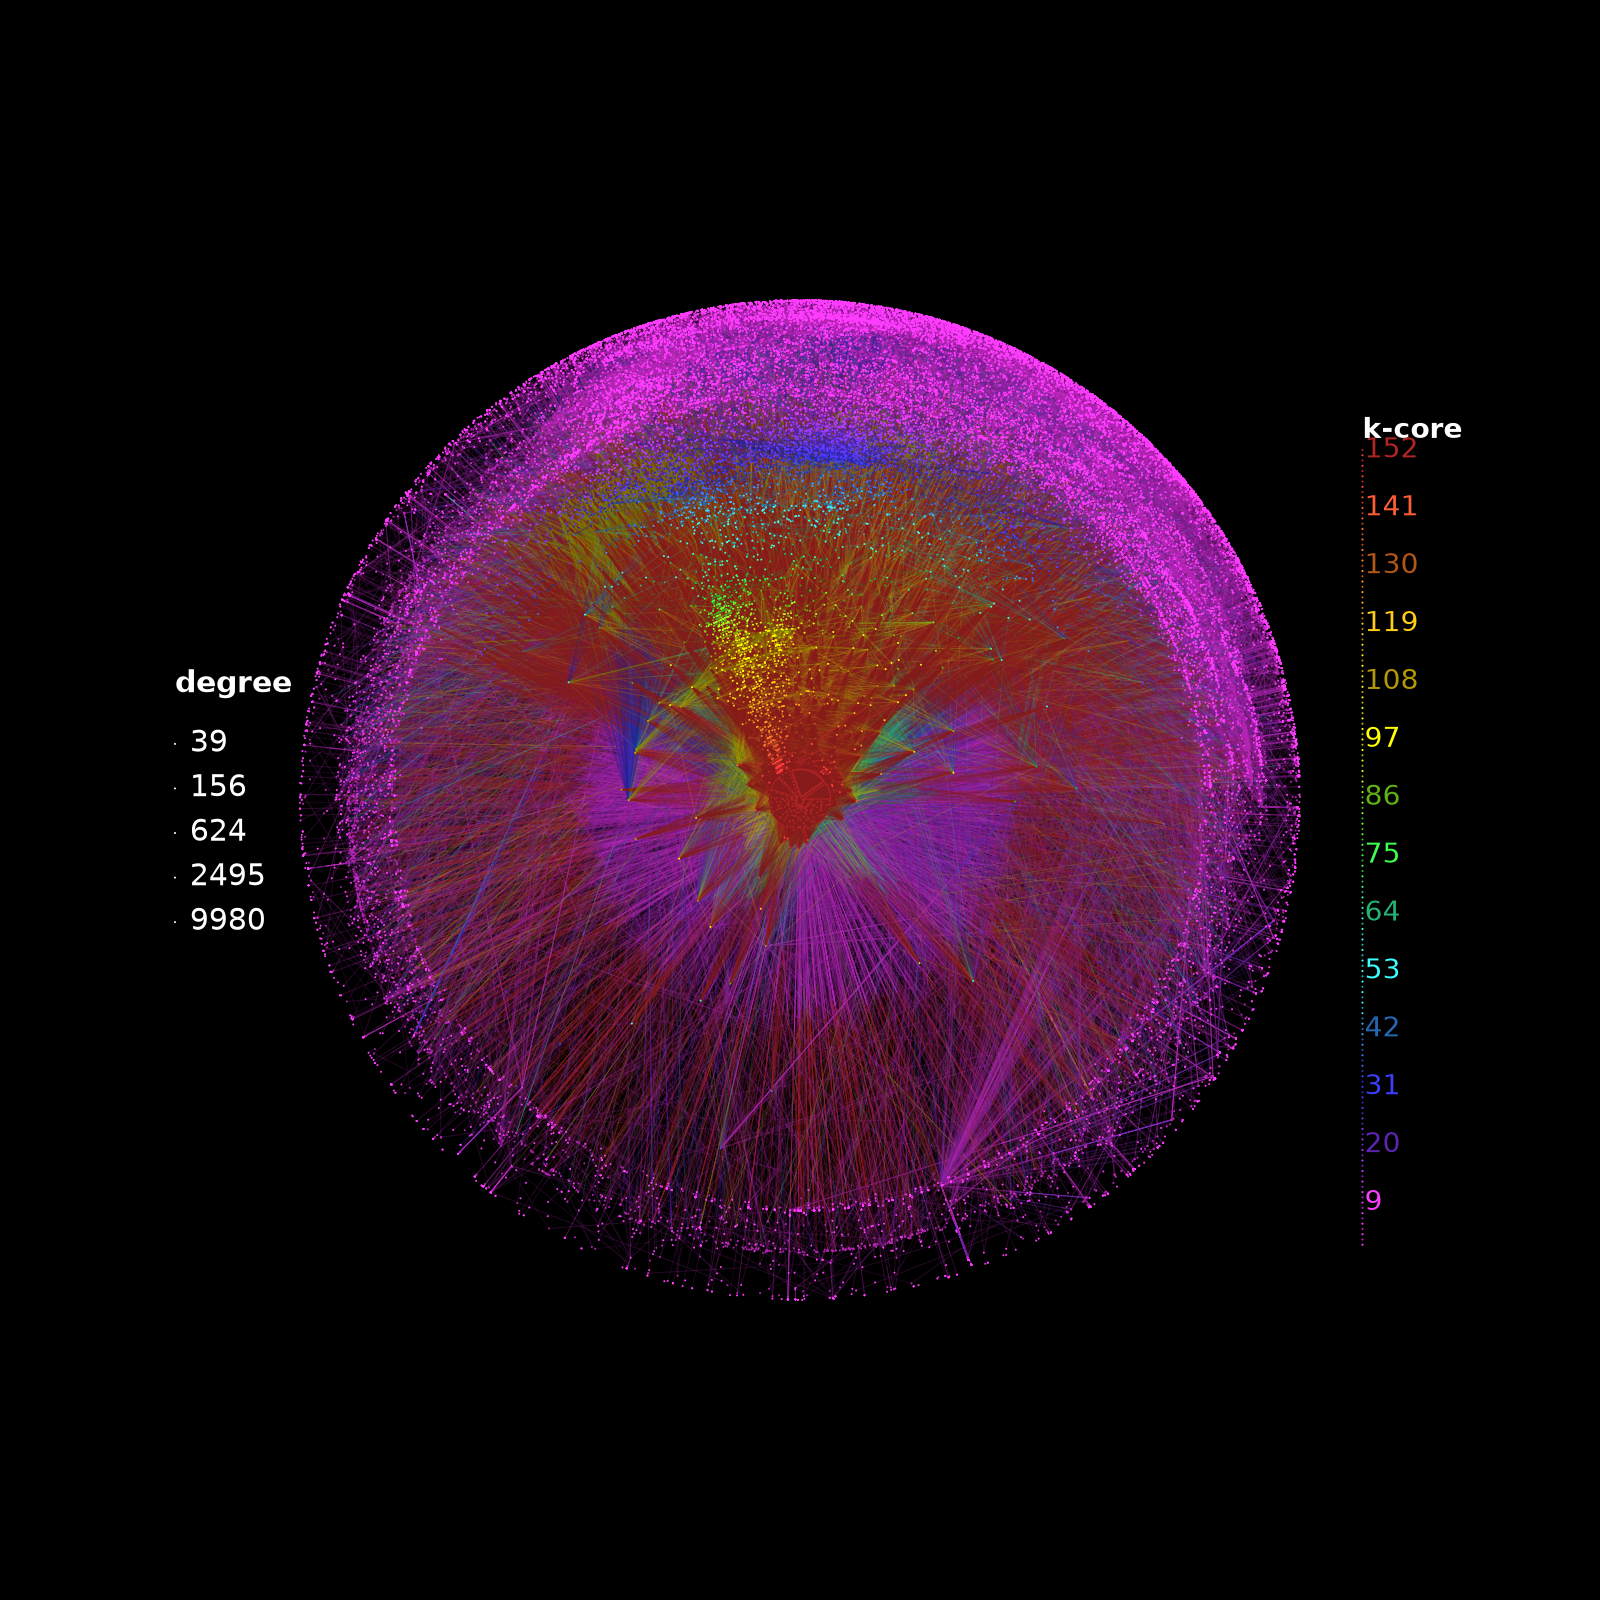
Internet AS-level topology
Autonomous Systems of the Internet and their inferred business relationships (CAIDA serial-1 snapshot 20260901). The innermost shells hold the large transit and content networks; the periphery is stub networks with one or two providers.
CAIDA, The CAIDA AS Relationships Dataset, 20260901.
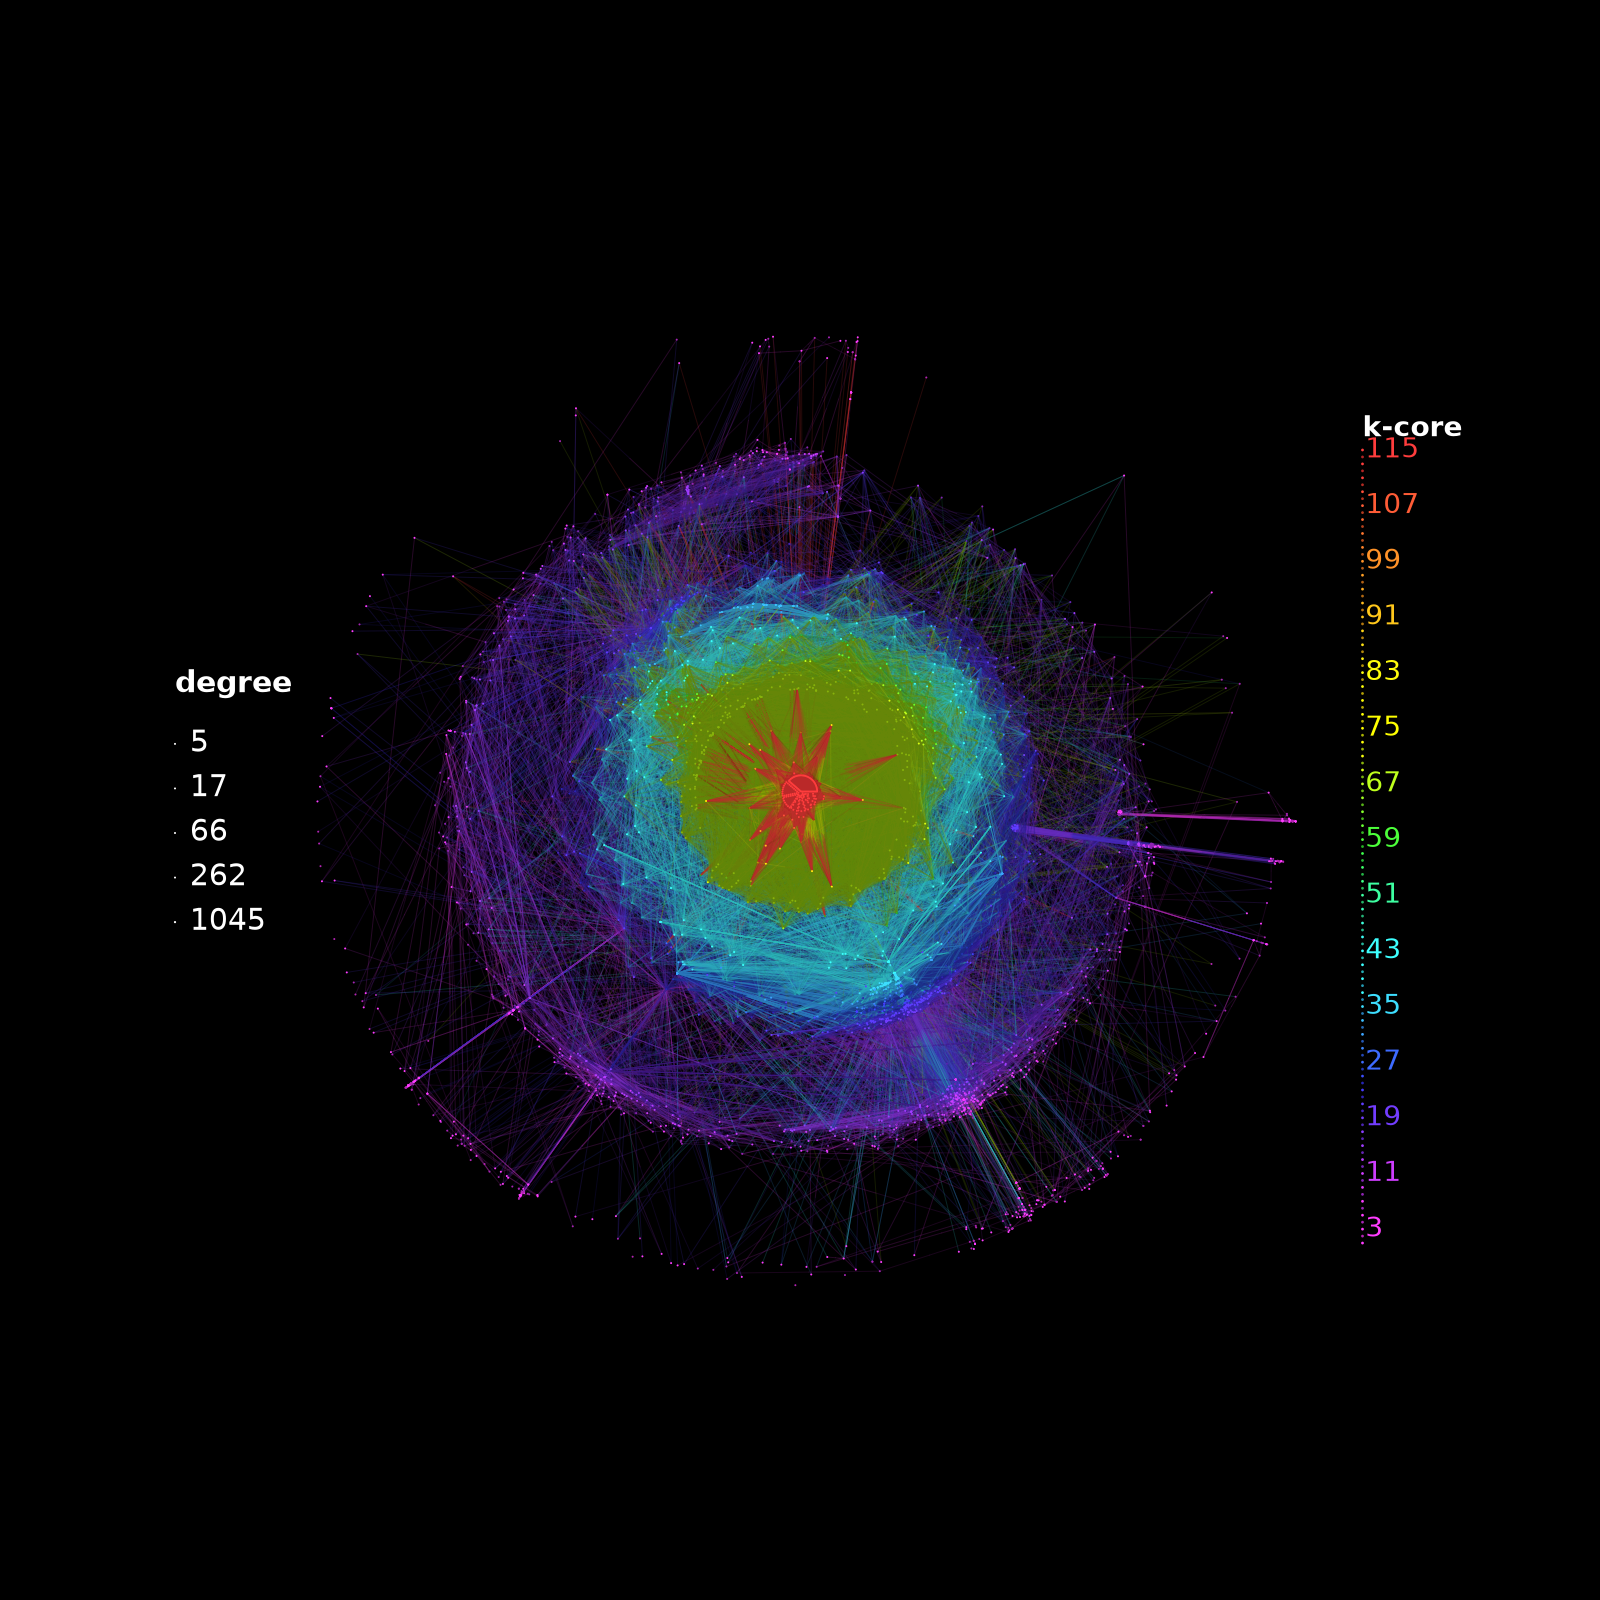
Facebook friendship circles
Friendship links from ten Facebook ego networks (anonymized survey participants and their friends). Dense friend groups appear as deep cores; the k-dense view isolates the triangle-rich cliques.
J. McAuley and J. Leskovec, Learning to Discover Social Circles in Ego Networks, NIPS 2012.
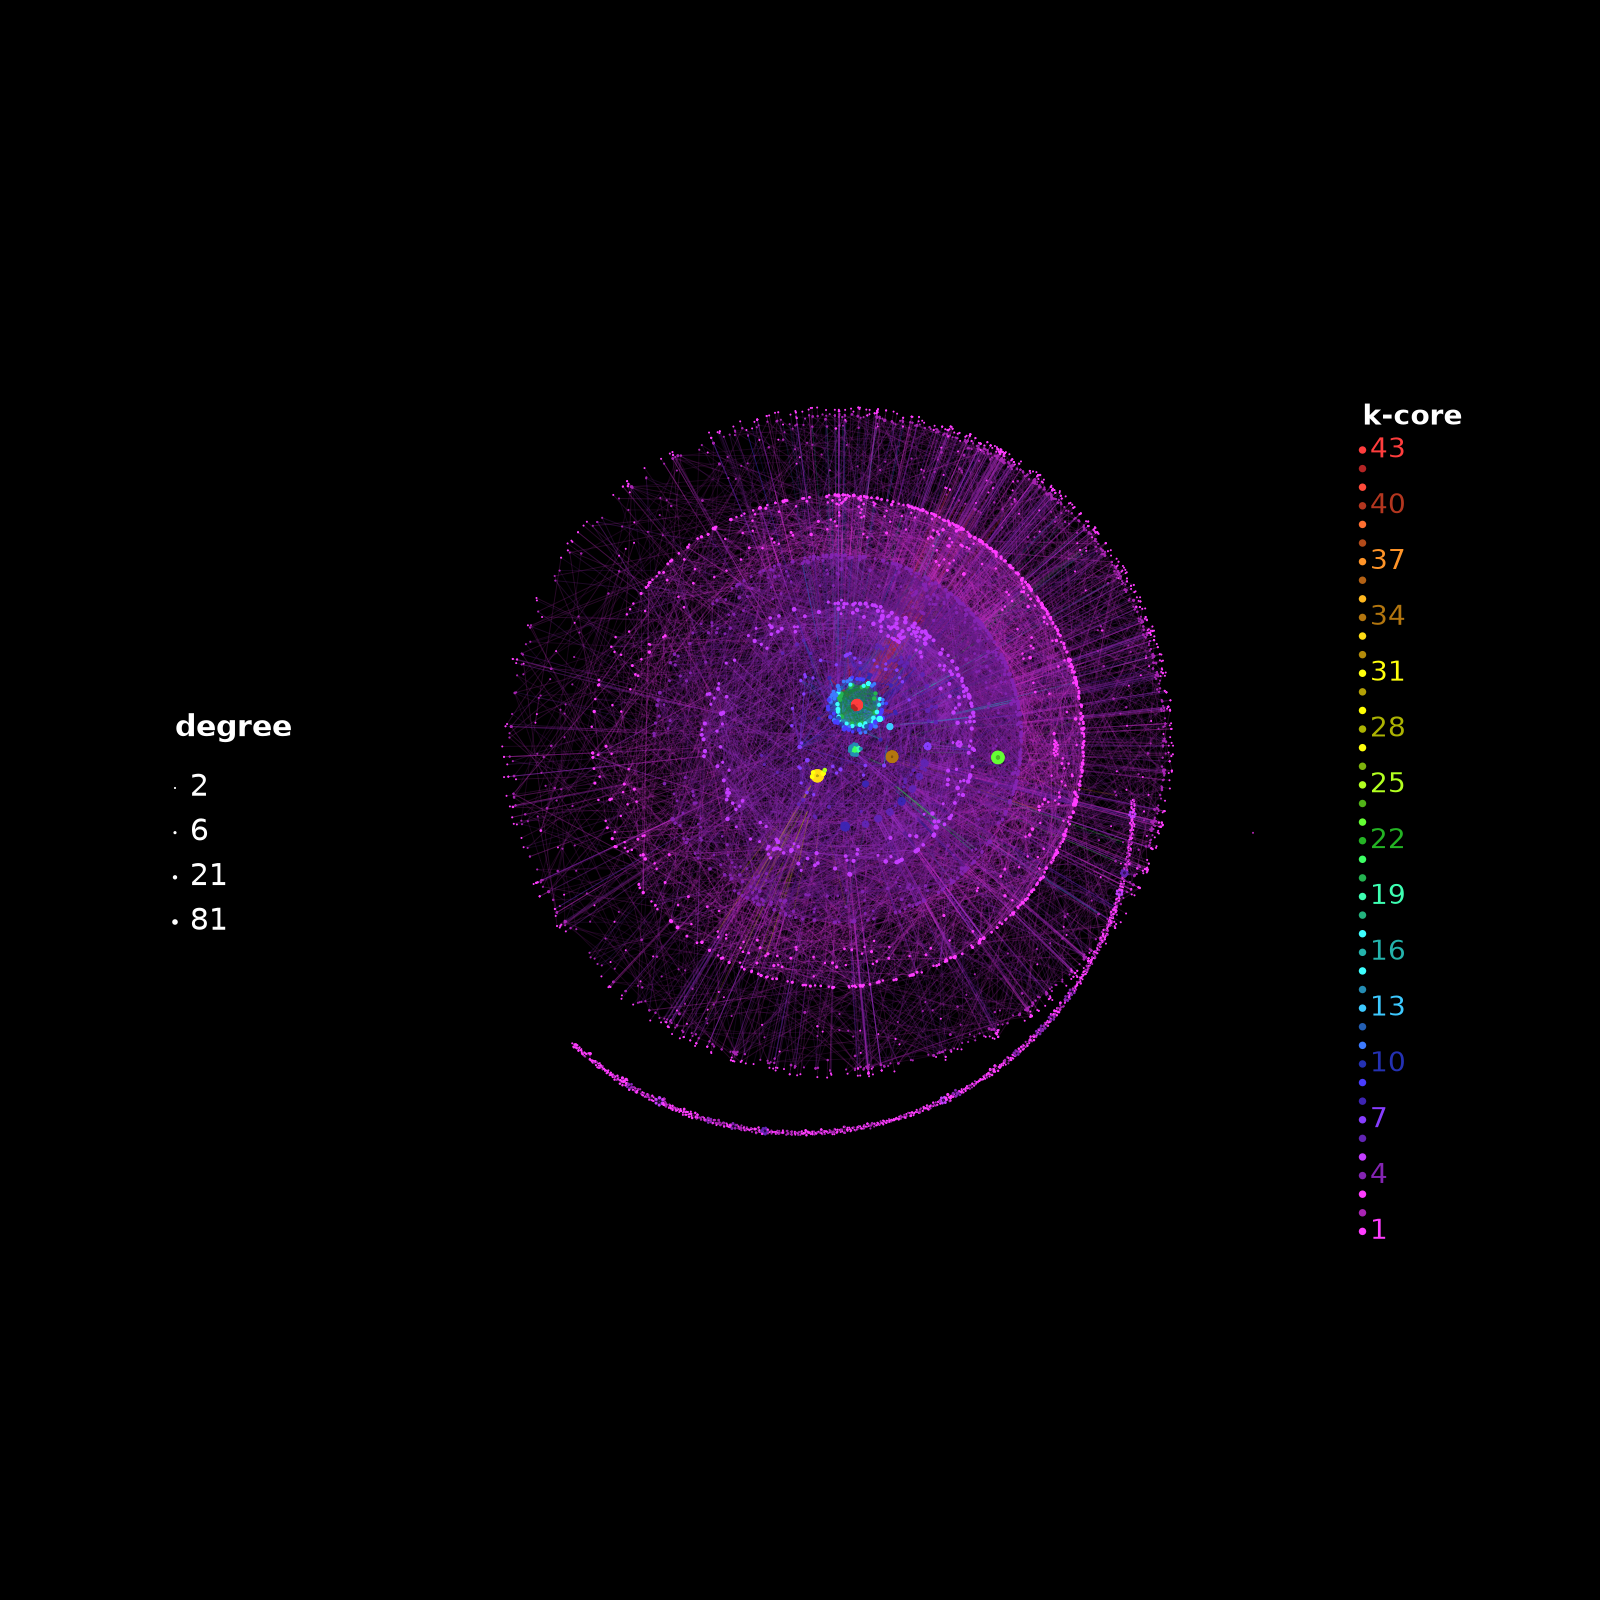
arXiv General Relativity co-authorship
Scientists who co-authored papers in the arXiv General Relativity and Quantum Cosmology category (1993-2003). Collaboration networks are shallow: a few tight groups form the core and most authors sit in the outer shells.
J. Leskovec, J. Kleinberg and C. Faloutsos, Graph Evolution: Densification and Shrinking Diameters, ACM TKDD 2007.
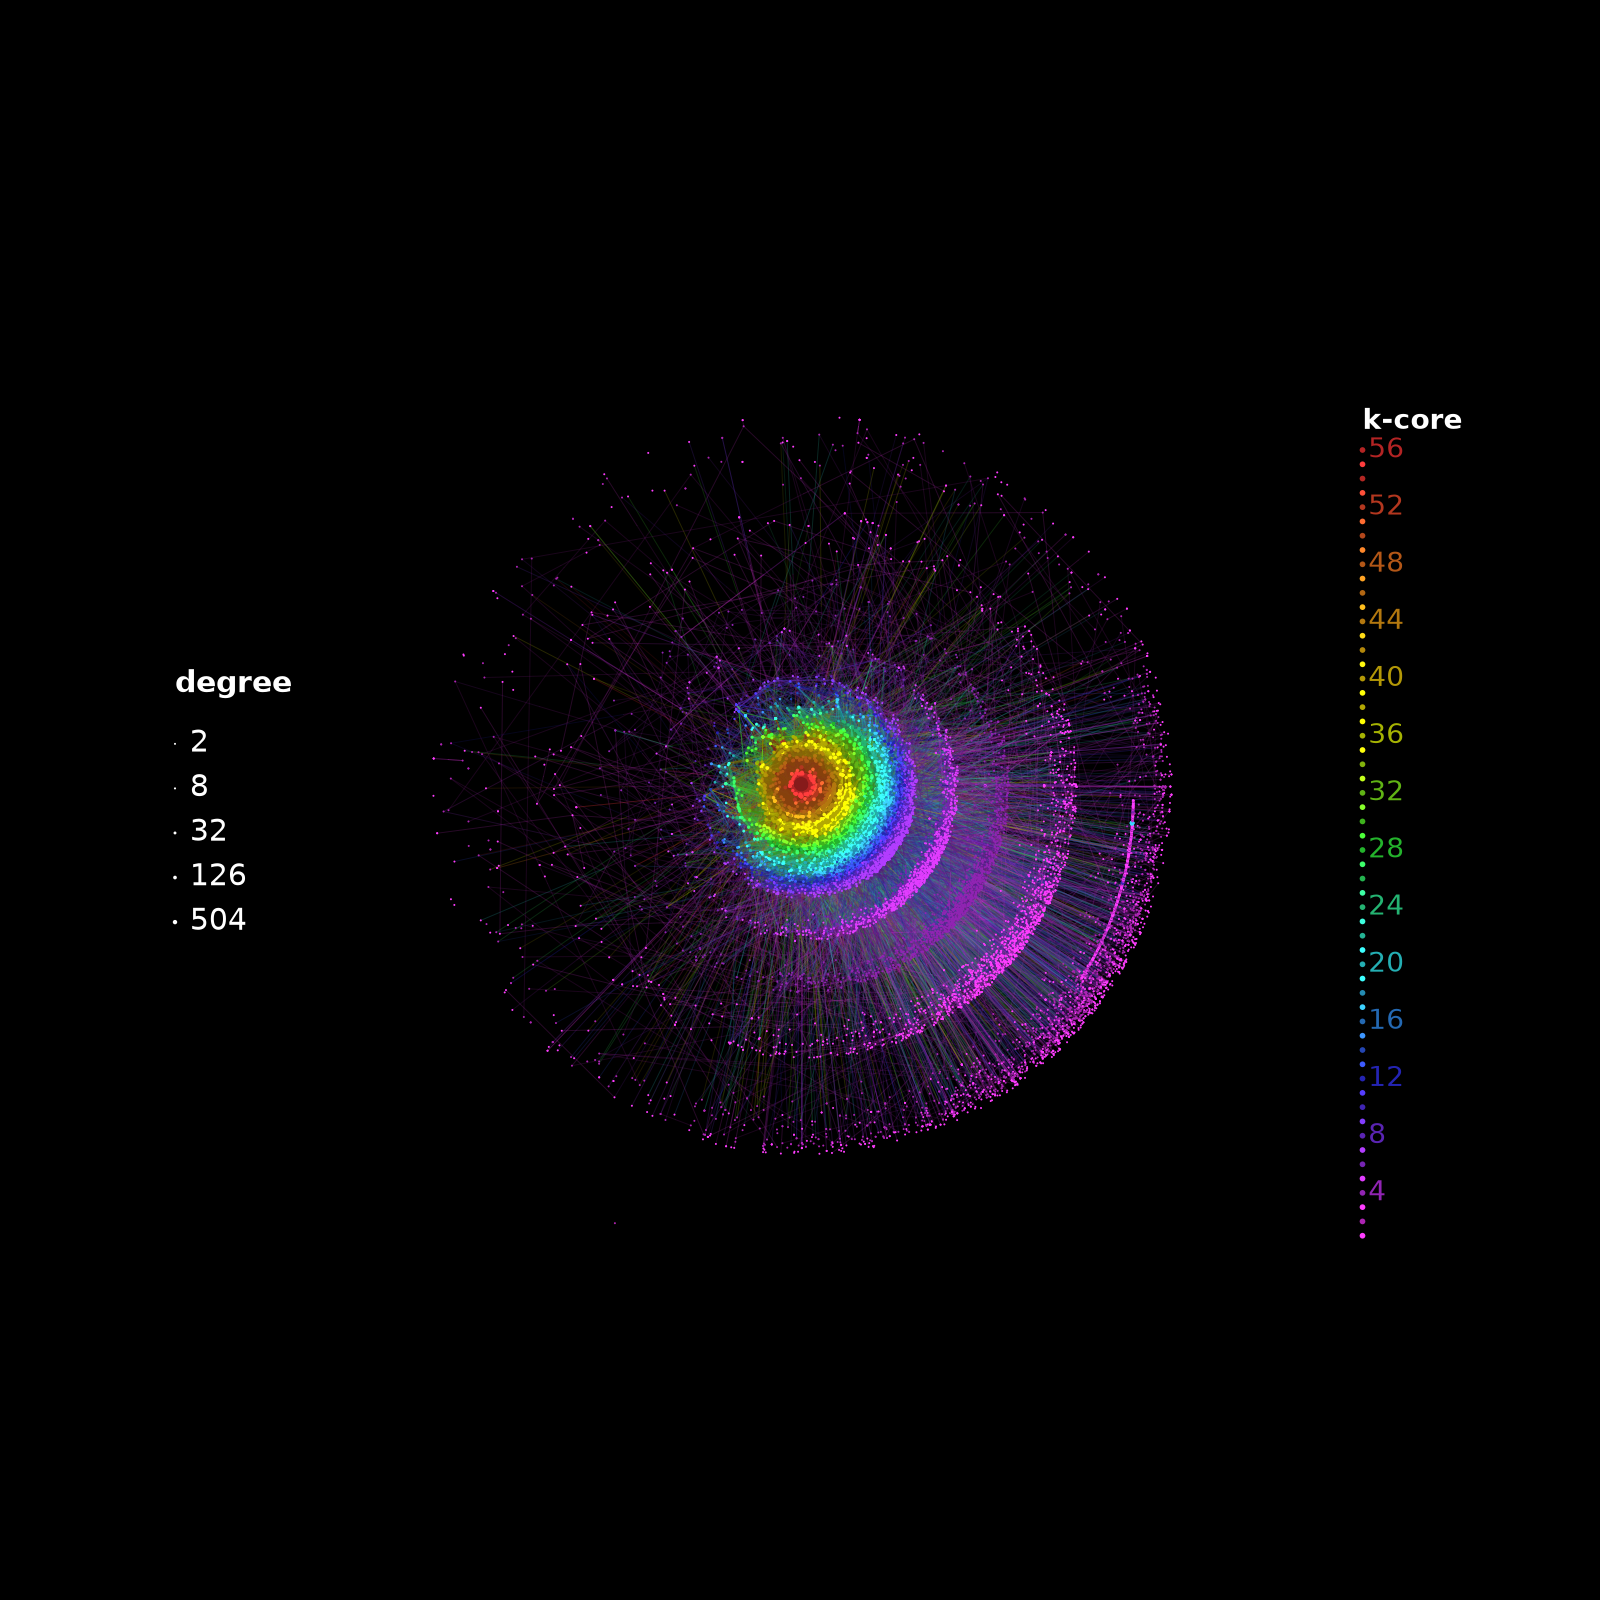
arXiv Astrophysics co-authorship
Co-authorship among arXiv Astrophysics authors (1993-2003). Large collaborations (instrument and survey teams) produce a much deeper core than General Relativity.
J. Leskovec, J. Kleinberg and C. Faloutsos, Graph Evolution: Densification and Shrinking Diameters, ACM TKDD 2007.
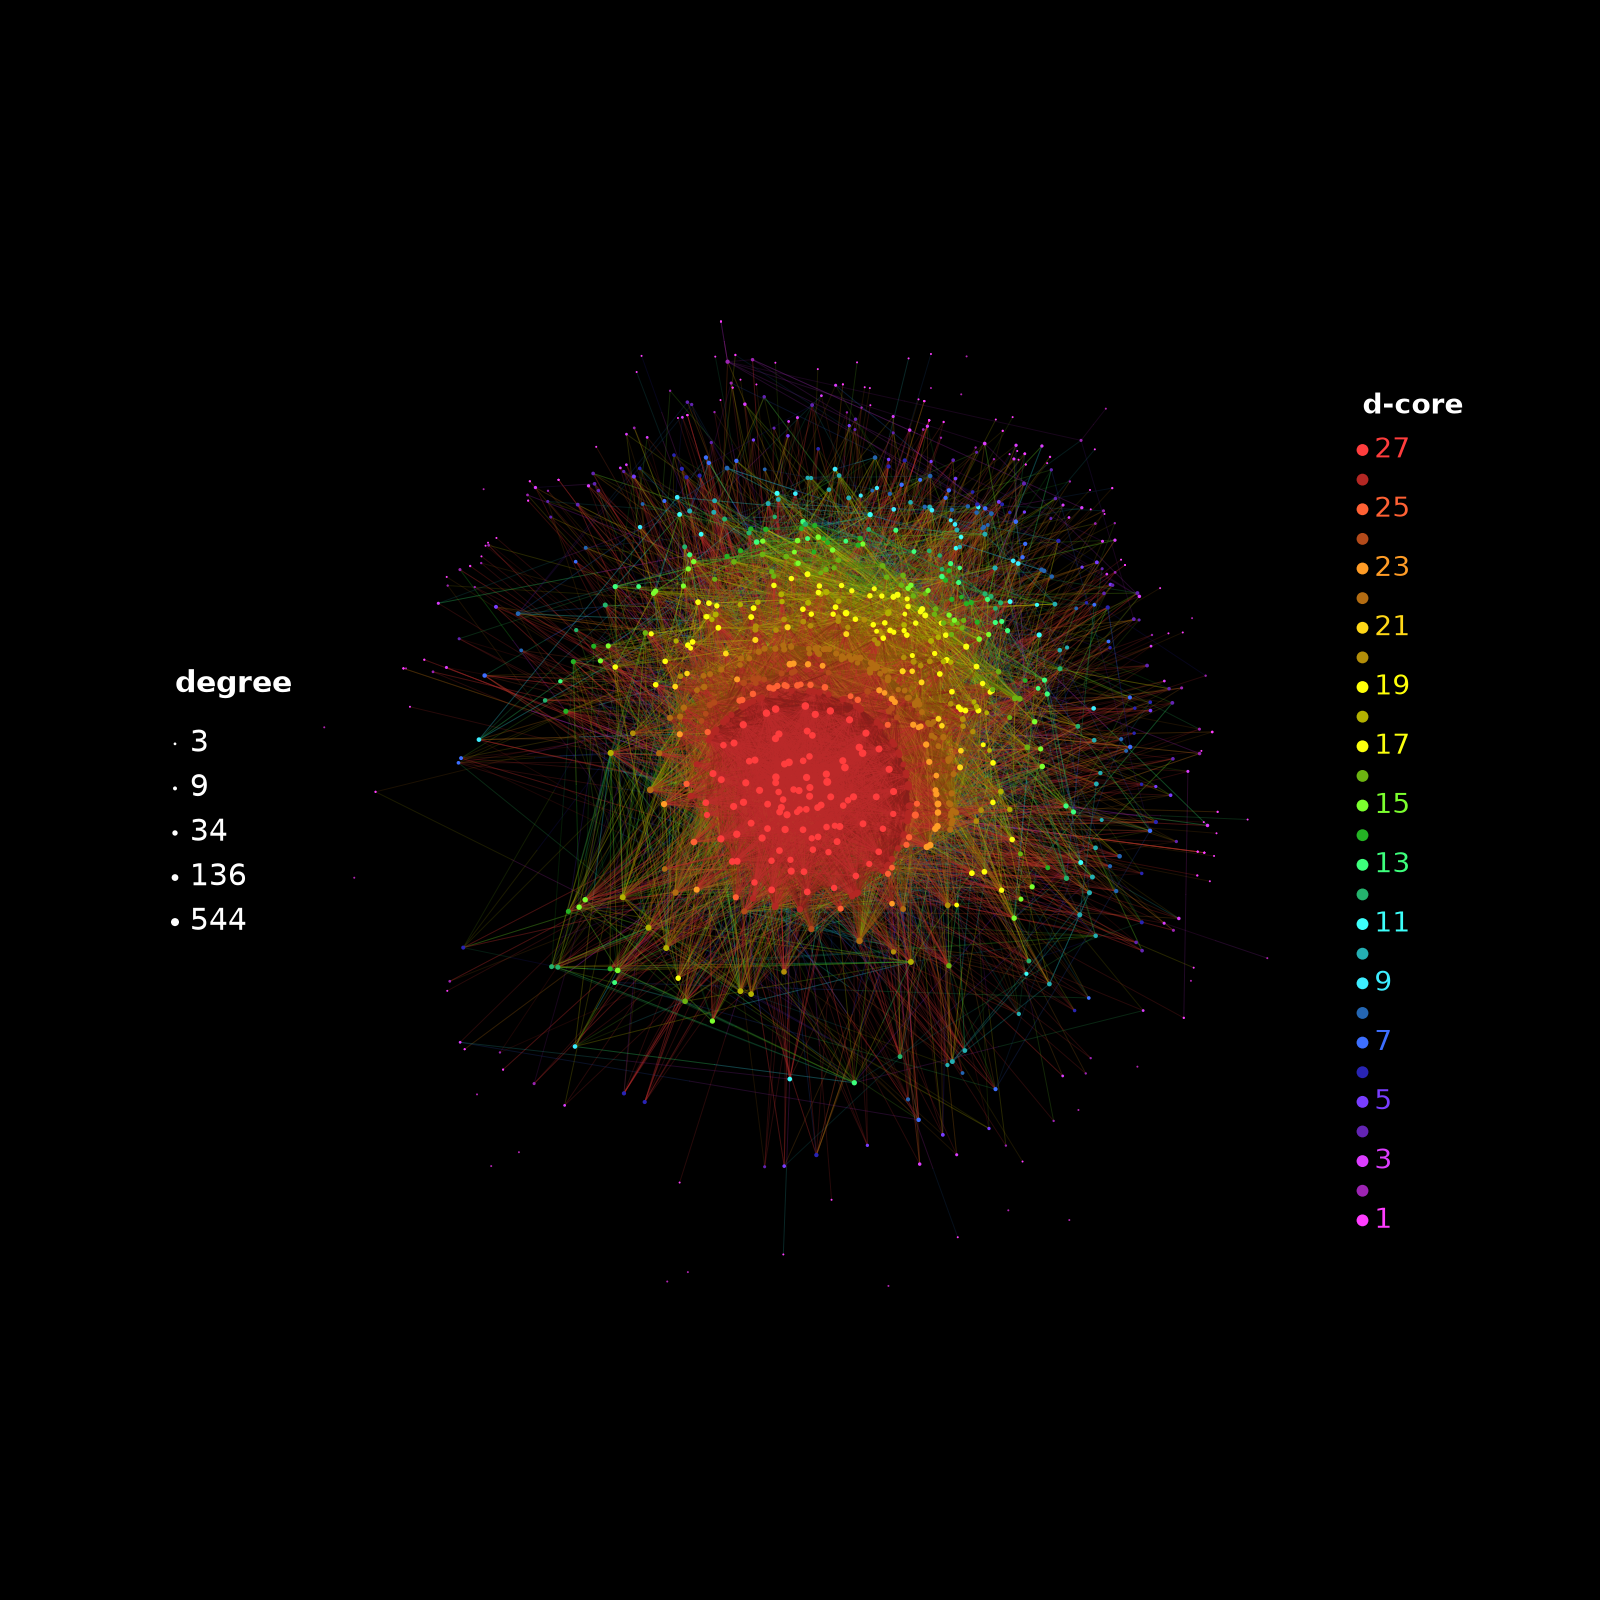
E-mail exchanges in a European research institution
Who e-mailed whom inside a large European research institution over 18 months. Directed edges make it a natural d-core example; the undirected k-core view is shown for comparison.
H. Yin, A. R. Benson, J. Leskovec and D. F. Gleich, Local Higher-order Graph Clustering, KDD 2017.
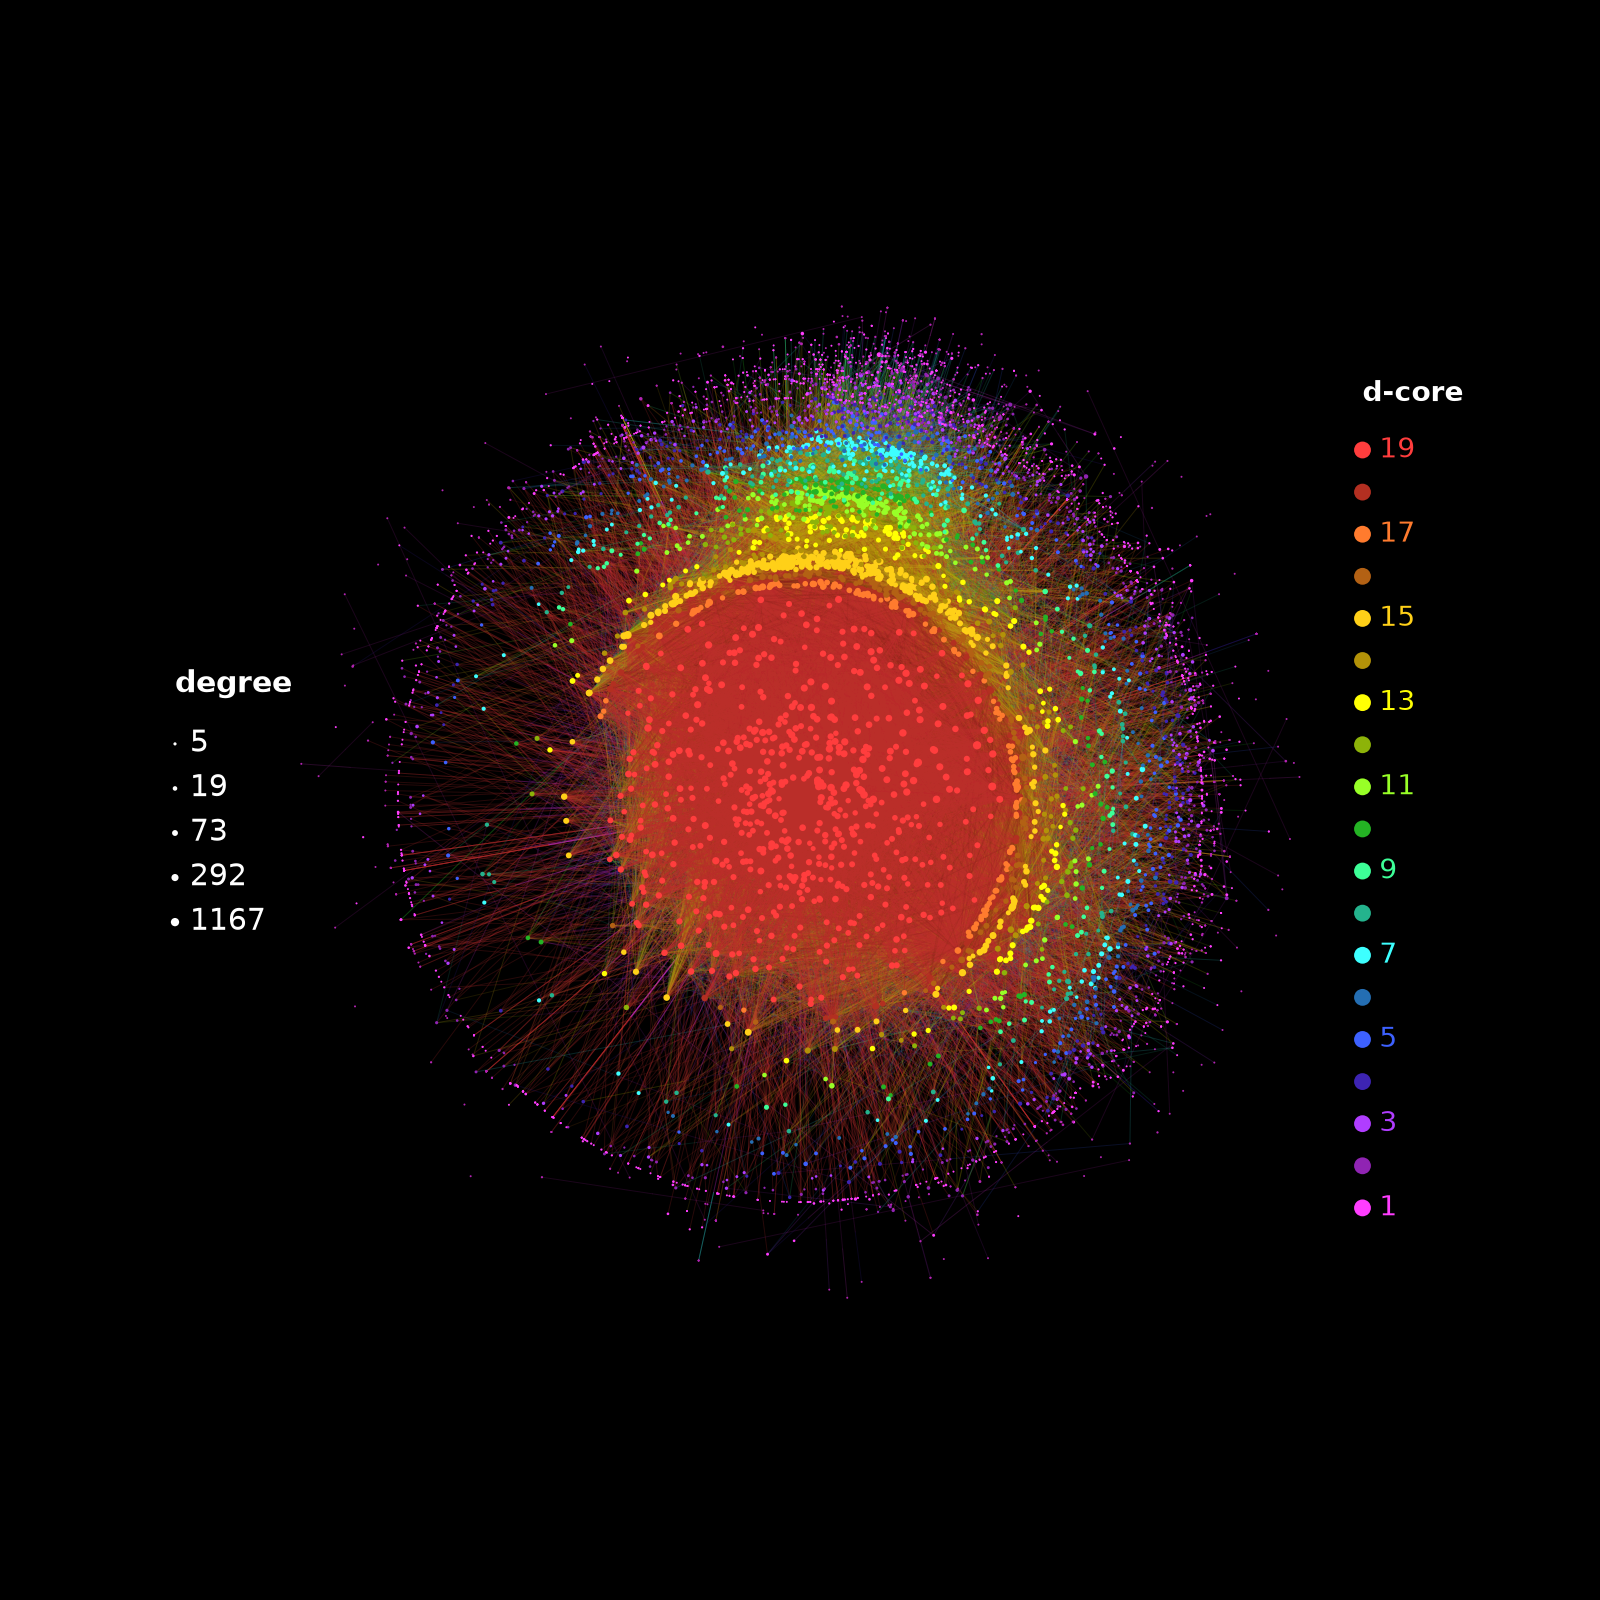
Wikipedia administrator elections
Votes cast in Wikipedia requests for adminship: a directed edge from voter to candidate. The d-core decomposition separates prolific voters from candidates who collect many votes.
J. Leskovec, D. Huttenlocher and J. Kleinberg, Signed Networks in Social Media, CHI 2010.
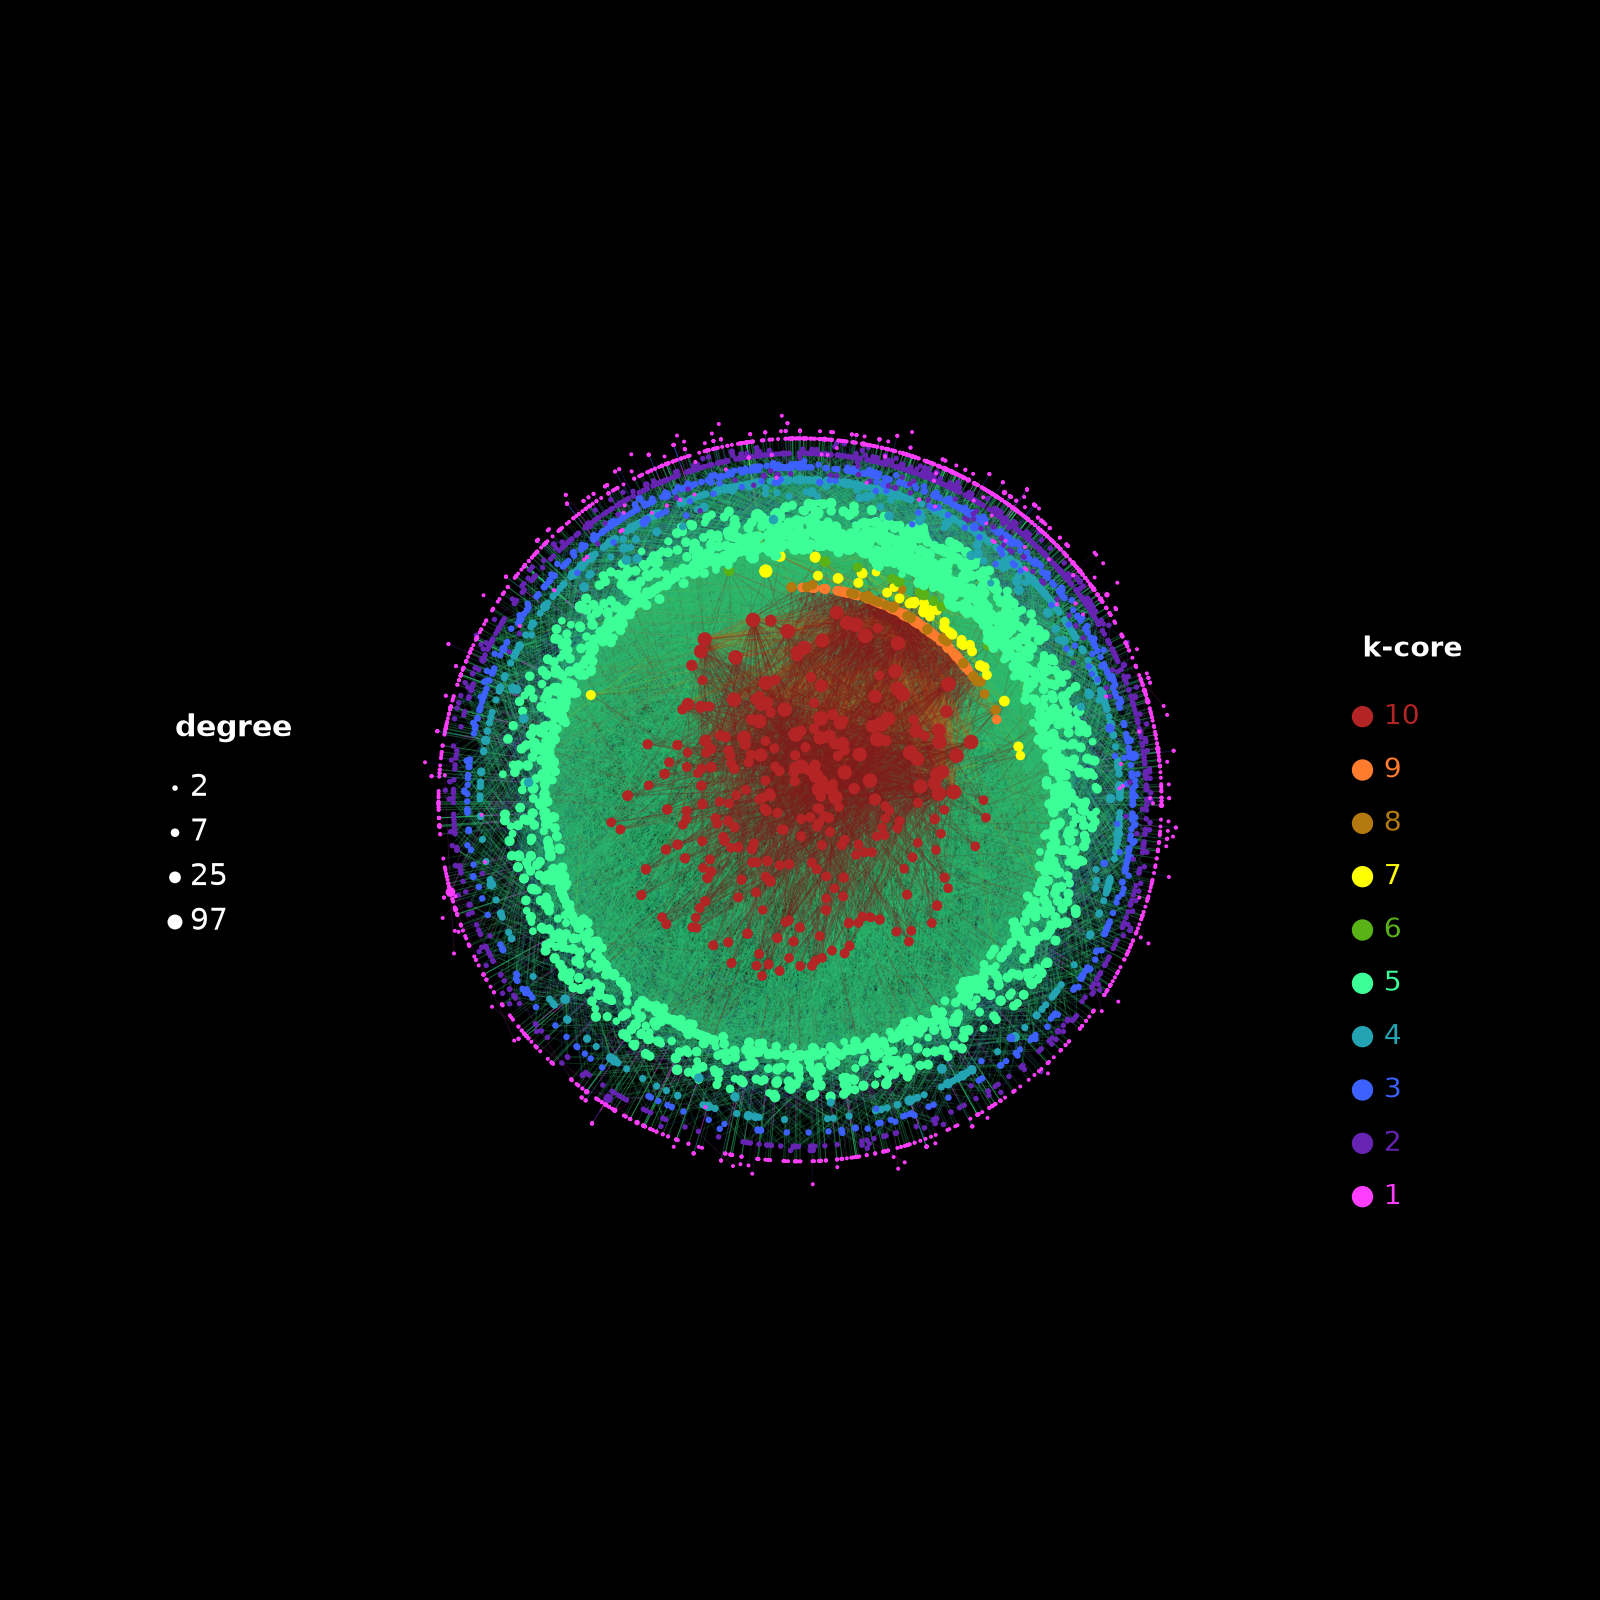
Gnutella peer-to-peer overlay
A snapshot of the Gnutella file-sharing overlay from August 2002 (hosts and their connections). Engineered overlays have a flat core structure compared with social or Internet graphs.
M. Ripeanu, I. Foster and A. Iamnitchi, Mapping the Gnutella Network, IEEE Internet Computing 2002.
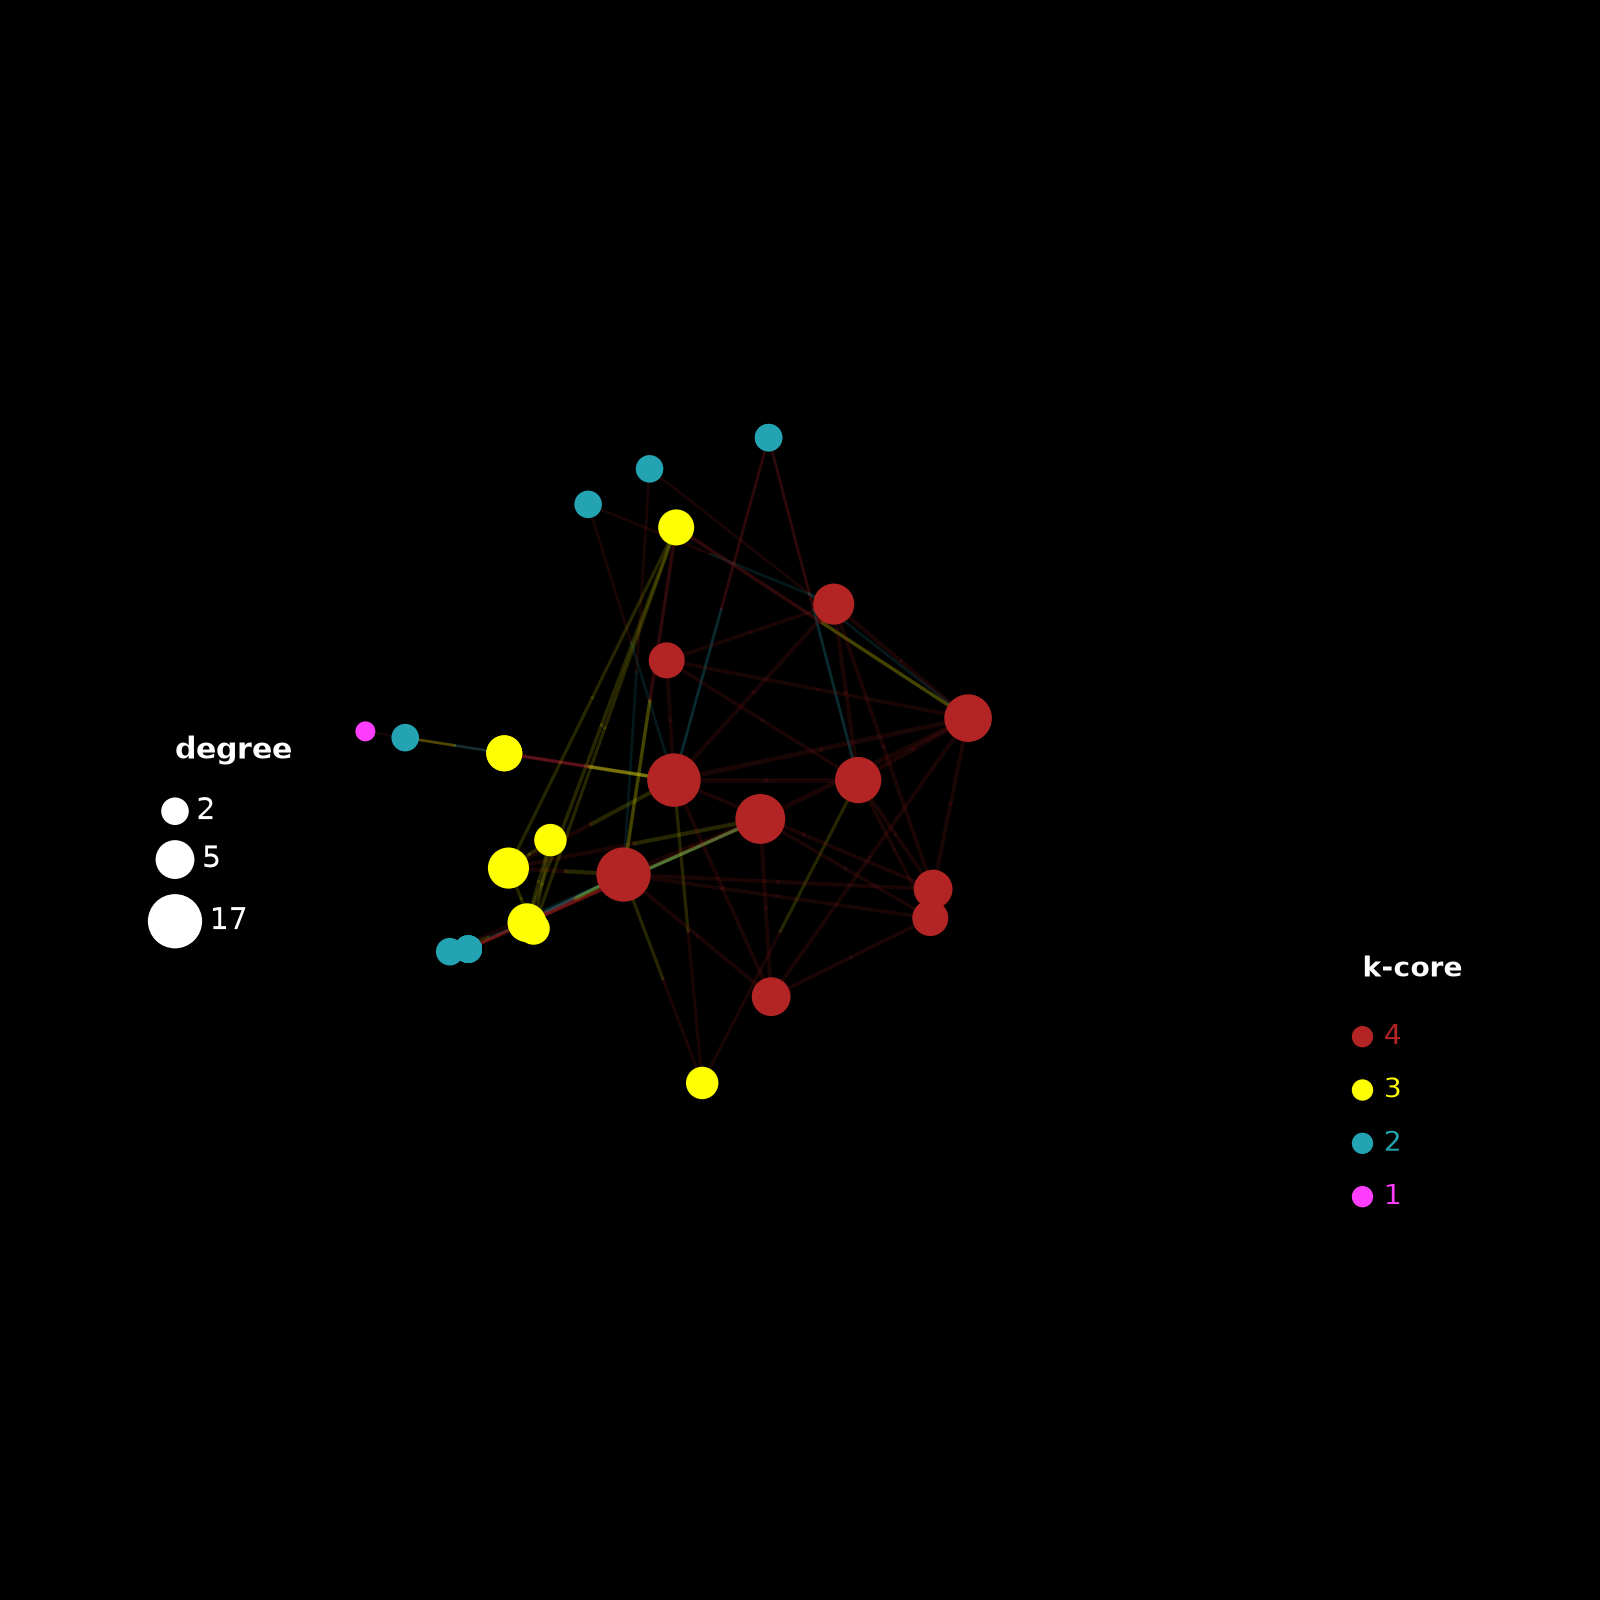
Zachary's karate club
The classic 34-member karate club studied by Wayne Zachary in 1977, bundled with NetworkX. Small enough to read every node; the two factions occupy the two halves of the outer shells.
W. W. Zachary, An Information Flow Model for Conflict and Fission in Small Groups, Journal of...
Methodology
Each dataset is downloaded from its public source, read as an edge list (self-loops dropped, third columns ignored unless they are real weights), decomposed and rendered with the LaNet-vi Python API. The layout is the classic LaNet-vi algorithm (Alvarez-Hamelin, Dall'Asta, Barrat and Vespignani, NIPS 2005): nodes are placed on concentric shells by decomposition index, the innermost core at the center; the radial position inside a shell follows the index of a node's neighbors, and the color scale runs from magenta (outer shells) to red (the maximum core). Node size grows with degree.
- k-cores: the k-core is the maximal subgraph in which every node has at least k neighbors; a node's index is the deepest core it belongs to.
- k-denses (m-cores): the same idea counting triangles instead of neighbors, so the index measures cohesion rather than degree. Directed graphs are rendered as undirected.
- d-cores: for directed graphs, cores defined jointly on in-degree and out-degree; the drawn index is the larger of the two.
Parameters (identical for every figure):
| LaNet-vi | 5.3.1 (NetworkX 3.7, Python 3.12.3) |
|---|---|
| Image | 1600 × 1600 px, black background |
| Layout | classic, seed 0 |
| Edges drawn | 50% of edges (at least 50,000), opacity 0.2 |
| Generated | 2026-09-29T19:49:18Z on Linux-6.17.0-1022-azure-x86_64-with-glibc2.39 (x86_64, 2 CPUs), by the Gallery workflow |
Statistics are measured on the loaded graph (for k-cores and k-denses of a directed
dataset, on its undirected version). Rendering time is wall-clock on the machine that
built the gallery and is only indicative. Reproduce everything with
uv run python scripts/build_gallery.py in the
website repository;
the manifest with all values is gallery.json.